Evaluating DFDs
Data flow diagram (DFD) is a picture of the movement of data between external entities and the processes and data stores within a system.
There are four types of symbol for a DFD:

Squares representing external entities, which are sources or destinations of data.

Rounded rectangles representing processes, which take data as input, do something to it, and output it.

Arrows representing the data flows, which can either be electronic data or physical items.

Open-ended rectangles representing data stores, including electronic stores such as databases or XML files and physical stores such as or filing cabinets or stacks of paper.
According to Craig Borysowich, the following are the steps in developing a data flow diagram.
• Start from the context diagram. Identify the parent process and the external entities with their net inputs and outputs.
• Place the external entities on the diagram. Draw the boundary.
• Identify the data flows needed to generate the net inputs and outputs to the external entities.
• Identify the business processes to perform the work needed to generate the input and output data flows.
• Connect the data flows from the external entities to the processes.
• Identify the data stores.
• Connect the processes and data stores with data flows.
• Apply the Process Model Paradigm to verify that the diagram addresses the processing needs of all external entities.
• Apply the External Control Paradigm to further validate that the flows to the external entities are correct.
• Continue to decompose to the nth level DFD. Draw all DFDs at one level before moving to the next level of decomposing detail. You should decompose horizontally first to a sufficient nth level to ensure that the processes are partitioned correctly; then you can begin to decompose vertically.
According to THIS website, the following are some guidelines in constructing effective Data Flow diagrams:
Choose meaningful names for processes, flows, stores, and terminators
The names chosen for the process names (as well as flow names and terminator names) should come from a vocabulary that is meaningful to the user. This will happen quite naturally if the DFD is drawn as a result of a series of interviews with the users and if the systems analyst has some minimal understanding of the underlying subject matter of the application. But two cautions must be kept in mind:
1. There is a natural tendency for users to use the specific abbreviation and acronyms that they are familiar with; this is true for both the processes and the flows that they describe. Unfortunately, this usually results in a DFD that is very heavily oriented to the way things happen to be done now. Thus, the user might say, “Well, we get a copy of Form 107 — it’s the pink copy, you know — and we send it over to Joe where it gets frogulated.” A good way to avoid such excessively idiosyncratic terms is to choose verbs (like “frogulate”) and objects (like “Form 107”) that would be meaningful to someone in the same industry or application, but working in a different company or organization. If you’re building a banking system, the process names and flow names should, ideally, be understandable to someone in a different bank.
2. If the DFD is being drawn by someone with a programming background, there will be a tendency to use such programming-oriented terminology as “ROUTINE,” “PROCEDURE,” “SUBSYSTEM,” and “FUNCTION,” even though such terms may be utterly meaningless in the user’s world. Unless you hear the users using these words in their own conversation, avoid them in your DFD.
Number the processes
As a convenient way of referencing the processes in a DFD, most systems analysts number each bubble. It doesn’t matter very much how you go about doing this — left to right, top to bottom, or any other convenient pattern will do -- as long as you are consistent in how you apply the numbers.
The only thing that you must keep in mind is that the numbering scheme will imply, to some casual readers of your DFD, a certain sequence of execution. That is, when you show the DFD to a user, he may ask, “Oh, does this mean that bubble 1 is performed first, and then bubble 2, and then bubble 3?” Indeed, you may get the same question from other systems analysts and programmers; anyone who is familiar with a flowchart may make the mistake of assuming that numbers attached to bubbles imply a sequence.
This is not the case at all. The DFD model is a network of communicating, asynchronous processes, which is, in fact, an accurate representation of the way most systems actually operate. Some sequence may be implied by the presence or absence of data (e.g., it may turn out that bubble 2 cannot carry out its function until it receives data from bubble 1), but the numbering scheme has nothing to do with this.
So why do we number the bubbles at all? Partly, as indicated above, as a convenient way of referring to the processes; it’s much easier in a lively discussion about a DFD to say “bubble 1” rather than “EDIT TRANSACTION AND REPORT ERRORS.”
Avoid Overly Complex DFDs
The purpose of a DFD is to accurately model the functions that a system has to carry out and the interactions between those functions. But another purpose of the DFD is to be read and understood, not only by the systems analyst who constructed the model, but by the users who are the experts in the subject matter. This means that the DFD should be readily understood, easily absorbed, and pleasing to the eye.
We will discuss a number of esthetic guidelines in the next subsection, but there is one overriding guideline to keep in mind: don’t create a DFD with too many processes, flows, stores, and terminators. In most cases, this means that you shouldn’t have more than half a dozen processes and related stores, flows, and terminators on a single diagram. Another way of saying this is that the DFD should fit comfortably onto a standard 8.5- by 11-inch sheet of paper.
Redraw the DFD As Many Times As Necessary
In a real-world systems analysis project, the DFD that we have discussed in this chapter will have to be drawn, redrawn, and redrawn again, often as many as ten times or more, before it is (1) technically correct, (2) acceptable to the user, and (3) neatly enough drawn that you wouldn’t be embarrassed to show it to the board of directors in your organization. This may seem like a lot of work, but it is well worth the effort to develop an accurate, consistent, esthetically pleasing model of the requirements of your system. The same is true of any other engineering discipline: would you want to fly in an airplane designed by engineers who got bored with their engineering drawings after the second iteration?
What makes a dataflow diagram esthetically pleasing? This is obviously a matter of personal taste and opinion, and it may be determined by standards set by your organization or by the idiosyncratic features of any automated workstation-based diagramming package that you use. And the user’s opinion may be somewhat different from yours; within reason, whatever the user finds esthetically pleasing should determine the way you draw your diagram. Some of the issues that will typically come up for discussion in this area are the following:
• Size and shape of bubbles. Some organizations draw dataflow diagrams with rectangles or ovals instead of circles; this is obviously a matter of esthetics. Also, some users become quite upset if the bubbles in the DFD are not all the same size: they think that if one bubble is bigger than another, it means that that part of the system is more important or is different in some other significant way. (In fact, it usually happens only because the bubble’s name was so long that the systems analyst had to draw a larger bubble just to encompass the name!)
• Curved dataflows versus straight dataflows. To illustrate this issue, consider the DFDs in Figure 9.16(a) and (b). Which one is more esthetically pleasing? Many observers will shrug their shoulders and say, “They’re really both the same.” But others — and this is the point! — will choose one and violently reject the other. It’s obviously a good idea to know in advance which choice will be accepted and which will be rejected. In roughly the same category is the issue of crossed arrows; are they allowed or not allowed?
• Hand-drawn diagrams versus machine-generated diagrams. There is hardly any excuse for hand-drawn diagrams today, since the typical systems analyst is almost certain to have access to a PC with reasonable drawing tools. The issue here, though, is the user’s reaction to these diagrams: some have a strong preference for the machine-generated diagrams because they’re “neater,” while others prefer hand drawn pictures because it gives them the feeling that the diagram hasn’t been finalized or “frozen” yet, and that they can still make changes.
Make Sure That Your DFD Is Logically Consistent
A number of rules and guidelines that help ensure the dataflow diagram is consistent with the other system models -- the entity-relationship diagram, the state-transition diagram, the data dictionary, and the process specification. However, there are some guidelines that we use now to ensure that the DFD itself is consistent. The major consistency guidelines are these:
• Avoid infinite sinks, bubbles that have inputs but no outputs. These are also known by systems analysts as “black holes,” in an analogy to stars whose gravitational field is so strong that not even light can escape.
• Avoid spontaneous generation bubbles; bubbles that have outputs but no inputs are suspicious, and generally incorrect. One plausible example of an output-only bubble is a random-number generator, but it is hard to imagine any other reasonable example.
• Beware of unlabeled flows and unlabeled processes. This is usually an indication of sloppiness, but it may mask an even deeper error: sometimes the systems analyst neglects to label a flow or a process because he or she simply cannot think of a reasonable name. In the case of an unlabeled flow, it may mean that several unrelated elementary data items have been arbitrarily packaged together; in the case of an unlabeled process, it may mean that the systems analyst was so confused that he or she drew a disguised flowchart instead of a dataflow diagram.
• Beware of read-only or write-only stores. This guideline is analogous to the guideline about input-only and output-only processes; a typical store should have both inputs and outputs. The only exception to this guideline is the external store, a store that serves as an interface between the system and some external terminator.
The following are some of the several common modeling rules that I followed when creating DFDs:
1. All processes must have at least one data flow in and one data flow out.
2. All processes should modify the incoming data, producing new forms of outgoing data.
3. Each data store must be involved with at least one data flow.
4. Each external entity must be involved with at least one data flow.
5. A data flow must be attached to at least one process.
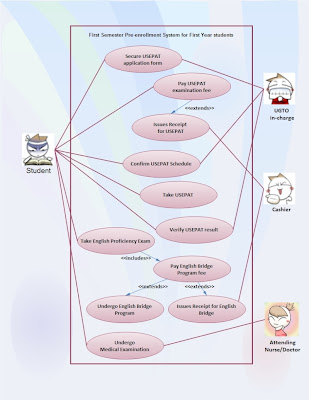
With reference to my assignments 8 and 9 regarding the construction of Data flow diagrams for the Pre-enrollment system, I examined the following characteristics in order to evaluate the quality of my DFDs.
According to Satzinger in his book Systems Analysis and Design in a Changing World,
An analyst must know how to minimize complexity. People have a limited ability to manipulate complex information. If too much information is presented at once, people experience a phenomenon called information overload. When information overload occurs, a person has difficulty in understanding. The key to avoiding information overload is to divide information into small and relatively independent subsets. Each subset should contain a comprehensible amount of information that people can examine and understand in isolation. A layered set of DFDs is an example of dividing a large set of information into small independent subsets. Each subset can be examined in isolation. The reader can find additional detail about a specific process by moving down to the next level or find information about how a DFD relates to other DFDs by examining the next-higher level of DFD.
An analyst can avoid information overload within any single DFD by following two simple rules of DFD construction: the 7 + 2 and interface minimization. The rule of 7 + 2 also known as Miller’s Number derives from psychology research which shows that the number of information ‘chunks’ that a person can remember and manipulate at one time varies between five and nine. A larger number of chunks causes information overload. Information chunks can be many things including names, words in a list, digits or components of a picture. Some application of the rule of 7 + 2 to DFDs includes the following: that a single DFD should have no more than 7 + 2 processes, no more than 7 + 2 data flow should enter or leave a process, data store or data element of a single DFD. These rules are general guidelines not unbreakable laws, DFDs that violate these rule may still be readable but violations should be considered a warning of potential problems.
Minimization of interfaces is directly related to 7 + 2. An interface is a connection to some other part of a problem or description. As with information chunks, the number of connections that a person can remember and manipulate is limited, so the number of connections should be kept to a minimum. Processes on DFD represent chunks of business or processing logic. They are related to other processes, entities and data stores by data flows. A single process with a large number of interfaces maybe too complex to understand. This complexity may show up directly on aprocess decomposition as a violation of the rule 7 + 2. An analyst can usually correct the problem by dividing the process into two or more subprocesses, each of which should have fewer interfaces.
Pairs or groups of processes with a large number of data flows between them are another violation of the interface minimization rule. Such a condition usually indicates a poor partitioning of processing tasks among the processes. The way to fix the problem is to reallocate the processing tasks so that fewer interfaces are required. The best division of work among processes is the simplest and the simplest division is one that requires the fewest interfaces among processes.
An analyst can detect errors and emissions in a set of DFDs by looking for specific types of inconsistency. Three common and easily identifiable consistency errors as follows; differences in data flow content between a process and its process decomposition, data outflows w/o corresponding data inflows, data inflows w/o corresponding outflows. A process of decomposition shows the internal details of a higher level process in a more detailed form. In most cases, the data content of flows to and from a process at one DFD level should be equivalent to the content of data flows to and from all processes in decomposition. The equivalency is called balancing and the higher level DFD and the process decomposition DFD are said to be in balance. Data flow names can vary among levels for a number of reasons including decomposition of one combined data flow into several smaller flows. Thus, the analyst must be careful to look at the components of data flows, not just data flow names. For this reason, detailed analysis of balancing should not be undertaken until data flows have been fully defined. Unbalance DFDs may be acceptable when the imbalance is due to data flows that were ignored at the higher levels. For example, diagram 0 for a large system usually ignores details of error handling such as when an item is ordered but it is later determined to be out of stock and discontinued by its manufacturer.
Another type of DFD inconsistency can occur between data inflows and outflows of a single process or data store. By definition, a process transforms data inflows and data outflows. Analysts sometimes can spot black holes and miracles simply by examining the DFD in other cases, close examination of data dictionary or process descriptions is required.
In a logical DFD, data should not be needlessly passed into process. The following consistency rules can be derived from these facts: that all data flows into a process must flow out of the process or be used to generate data that flows out the process, all data that flows out process must have flowed into the process or have been generated from data that flowed into process.
References:
Systems Analysis and Design in a Changing World By John W. Satzinger
http://www.agilemodeling.com/artifacts/dataFlowDiagram.htm
http://it.toolbox.com/blogs/enterprise-solutions/data-flow-diagrams-dfds-14573
http://yourdon.com/strucanalysis/wiki/index.php?title=Chapter_9
There are four types of symbol for a DFD:
Squares representing external entities, which are sources or destinations of data.
Rounded rectangles representing processes, which take data as input, do something to it, and output it.
Arrows representing the data flows, which can either be electronic data or physical items.
Open-ended rectangles representing data stores, including electronic stores such as databases or XML files and physical stores such as or filing cabinets or stacks of paper.
According to Craig Borysowich, the following are the steps in developing a data flow diagram.
• Start from the context diagram. Identify the parent process and the external entities with their net inputs and outputs.
• Place the external entities on the diagram. Draw the boundary.
• Identify the data flows needed to generate the net inputs and outputs to the external entities.
• Identify the business processes to perform the work needed to generate the input and output data flows.
• Connect the data flows from the external entities to the processes.
• Identify the data stores.
• Connect the processes and data stores with data flows.
• Apply the Process Model Paradigm to verify that the diagram addresses the processing needs of all external entities.
• Apply the External Control Paradigm to further validate that the flows to the external entities are correct.
• Continue to decompose to the nth level DFD. Draw all DFDs at one level before moving to the next level of decomposing detail. You should decompose horizontally first to a sufficient nth level to ensure that the processes are partitioned correctly; then you can begin to decompose vertically.
According to THIS website, the following are some guidelines in constructing effective Data Flow diagrams:
Choose meaningful names for processes, flows, stores, and terminators
The names chosen for the process names (as well as flow names and terminator names) should come from a vocabulary that is meaningful to the user. This will happen quite naturally if the DFD is drawn as a result of a series of interviews with the users and if the systems analyst has some minimal understanding of the underlying subject matter of the application. But two cautions must be kept in mind:
1. There is a natural tendency for users to use the specific abbreviation and acronyms that they are familiar with; this is true for both the processes and the flows that they describe. Unfortunately, this usually results in a DFD that is very heavily oriented to the way things happen to be done now. Thus, the user might say, “Well, we get a copy of Form 107 — it’s the pink copy, you know — and we send it over to Joe where it gets frogulated.” A good way to avoid such excessively idiosyncratic terms is to choose verbs (like “frogulate”) and objects (like “Form 107”) that would be meaningful to someone in the same industry or application, but working in a different company or organization. If you’re building a banking system, the process names and flow names should, ideally, be understandable to someone in a different bank.
2. If the DFD is being drawn by someone with a programming background, there will be a tendency to use such programming-oriented terminology as “ROUTINE,” “PROCEDURE,” “SUBSYSTEM,” and “FUNCTION,” even though such terms may be utterly meaningless in the user’s world. Unless you hear the users using these words in their own conversation, avoid them in your DFD.
Number the processes
As a convenient way of referencing the processes in a DFD, most systems analysts number each bubble. It doesn’t matter very much how you go about doing this — left to right, top to bottom, or any other convenient pattern will do -- as long as you are consistent in how you apply the numbers.
The only thing that you must keep in mind is that the numbering scheme will imply, to some casual readers of your DFD, a certain sequence of execution. That is, when you show the DFD to a user, he may ask, “Oh, does this mean that bubble 1 is performed first, and then bubble 2, and then bubble 3?” Indeed, you may get the same question from other systems analysts and programmers; anyone who is familiar with a flowchart may make the mistake of assuming that numbers attached to bubbles imply a sequence.
This is not the case at all. The DFD model is a network of communicating, asynchronous processes, which is, in fact, an accurate representation of the way most systems actually operate. Some sequence may be implied by the presence or absence of data (e.g., it may turn out that bubble 2 cannot carry out its function until it receives data from bubble 1), but the numbering scheme has nothing to do with this.
So why do we number the bubbles at all? Partly, as indicated above, as a convenient way of referring to the processes; it’s much easier in a lively discussion about a DFD to say “bubble 1” rather than “EDIT TRANSACTION AND REPORT ERRORS.”
Avoid Overly Complex DFDs
The purpose of a DFD is to accurately model the functions that a system has to carry out and the interactions between those functions. But another purpose of the DFD is to be read and understood, not only by the systems analyst who constructed the model, but by the users who are the experts in the subject matter. This means that the DFD should be readily understood, easily absorbed, and pleasing to the eye.
We will discuss a number of esthetic guidelines in the next subsection, but there is one overriding guideline to keep in mind: don’t create a DFD with too many processes, flows, stores, and terminators. In most cases, this means that you shouldn’t have more than half a dozen processes and related stores, flows, and terminators on a single diagram. Another way of saying this is that the DFD should fit comfortably onto a standard 8.5- by 11-inch sheet of paper.
Redraw the DFD As Many Times As Necessary
In a real-world systems analysis project, the DFD that we have discussed in this chapter will have to be drawn, redrawn, and redrawn again, often as many as ten times or more, before it is (1) technically correct, (2) acceptable to the user, and (3) neatly enough drawn that you wouldn’t be embarrassed to show it to the board of directors in your organization. This may seem like a lot of work, but it is well worth the effort to develop an accurate, consistent, esthetically pleasing model of the requirements of your system. The same is true of any other engineering discipline: would you want to fly in an airplane designed by engineers who got bored with their engineering drawings after the second iteration?
What makes a dataflow diagram esthetically pleasing? This is obviously a matter of personal taste and opinion, and it may be determined by standards set by your organization or by the idiosyncratic features of any automated workstation-based diagramming package that you use. And the user’s opinion may be somewhat different from yours; within reason, whatever the user finds esthetically pleasing should determine the way you draw your diagram. Some of the issues that will typically come up for discussion in this area are the following:
• Size and shape of bubbles. Some organizations draw dataflow diagrams with rectangles or ovals instead of circles; this is obviously a matter of esthetics. Also, some users become quite upset if the bubbles in the DFD are not all the same size: they think that if one bubble is bigger than another, it means that that part of the system is more important or is different in some other significant way. (In fact, it usually happens only because the bubble’s name was so long that the systems analyst had to draw a larger bubble just to encompass the name!)
• Curved dataflows versus straight dataflows. To illustrate this issue, consider the DFDs in Figure 9.16(a) and (b). Which one is more esthetically pleasing? Many observers will shrug their shoulders and say, “They’re really both the same.” But others — and this is the point! — will choose one and violently reject the other. It’s obviously a good idea to know in advance which choice will be accepted and which will be rejected. In roughly the same category is the issue of crossed arrows; are they allowed or not allowed?
• Hand-drawn diagrams versus machine-generated diagrams. There is hardly any excuse for hand-drawn diagrams today, since the typical systems analyst is almost certain to have access to a PC with reasonable drawing tools. The issue here, though, is the user’s reaction to these diagrams: some have a strong preference for the machine-generated diagrams because they’re “neater,” while others prefer hand drawn pictures because it gives them the feeling that the diagram hasn’t been finalized or “frozen” yet, and that they can still make changes.
Make Sure That Your DFD Is Logically Consistent
A number of rules and guidelines that help ensure the dataflow diagram is consistent with the other system models -- the entity-relationship diagram, the state-transition diagram, the data dictionary, and the process specification. However, there are some guidelines that we use now to ensure that the DFD itself is consistent. The major consistency guidelines are these:
• Avoid infinite sinks, bubbles that have inputs but no outputs. These are also known by systems analysts as “black holes,” in an analogy to stars whose gravitational field is so strong that not even light can escape.
• Avoid spontaneous generation bubbles; bubbles that have outputs but no inputs are suspicious, and generally incorrect. One plausible example of an output-only bubble is a random-number generator, but it is hard to imagine any other reasonable example.
• Beware of unlabeled flows and unlabeled processes. This is usually an indication of sloppiness, but it may mask an even deeper error: sometimes the systems analyst neglects to label a flow or a process because he or she simply cannot think of a reasonable name. In the case of an unlabeled flow, it may mean that several unrelated elementary data items have been arbitrarily packaged together; in the case of an unlabeled process, it may mean that the systems analyst was so confused that he or she drew a disguised flowchart instead of a dataflow diagram.
• Beware of read-only or write-only stores. This guideline is analogous to the guideline about input-only and output-only processes; a typical store should have both inputs and outputs. The only exception to this guideline is the external store, a store that serves as an interface between the system and some external terminator.
The following are some of the several common modeling rules that I followed when creating DFDs:
1. All processes must have at least one data flow in and one data flow out.
2. All processes should modify the incoming data, producing new forms of outgoing data.
3. Each data store must be involved with at least one data flow.
4. Each external entity must be involved with at least one data flow.
5. A data flow must be attached to at least one process.
With reference to my assignments 8 and 9 regarding the construction of Data flow diagrams for the Pre-enrollment system, I examined the following characteristics in order to evaluate the quality of my DFDs.
According to Satzinger in his book Systems Analysis and Design in a Changing World,
An analyst must know how to minimize complexity. People have a limited ability to manipulate complex information. If too much information is presented at once, people experience a phenomenon called information overload. When information overload occurs, a person has difficulty in understanding. The key to avoiding information overload is to divide information into small and relatively independent subsets. Each subset should contain a comprehensible amount of information that people can examine and understand in isolation. A layered set of DFDs is an example of dividing a large set of information into small independent subsets. Each subset can be examined in isolation. The reader can find additional detail about a specific process by moving down to the next level or find information about how a DFD relates to other DFDs by examining the next-higher level of DFD.
An analyst can avoid information overload within any single DFD by following two simple rules of DFD construction: the 7 + 2 and interface minimization. The rule of 7 + 2 also known as Miller’s Number derives from psychology research which shows that the number of information ‘chunks’ that a person can remember and manipulate at one time varies between five and nine. A larger number of chunks causes information overload. Information chunks can be many things including names, words in a list, digits or components of a picture. Some application of the rule of 7 + 2 to DFDs includes the following: that a single DFD should have no more than 7 + 2 processes, no more than 7 + 2 data flow should enter or leave a process, data store or data element of a single DFD. These rules are general guidelines not unbreakable laws, DFDs that violate these rule may still be readable but violations should be considered a warning of potential problems.
Minimization of interfaces is directly related to 7 + 2. An interface is a connection to some other part of a problem or description. As with information chunks, the number of connections that a person can remember and manipulate is limited, so the number of connections should be kept to a minimum. Processes on DFD represent chunks of business or processing logic. They are related to other processes, entities and data stores by data flows. A single process with a large number of interfaces maybe too complex to understand. This complexity may show up directly on aprocess decomposition as a violation of the rule 7 + 2. An analyst can usually correct the problem by dividing the process into two or more subprocesses, each of which should have fewer interfaces.
Pairs or groups of processes with a large number of data flows between them are another violation of the interface minimization rule. Such a condition usually indicates a poor partitioning of processing tasks among the processes. The way to fix the problem is to reallocate the processing tasks so that fewer interfaces are required. The best division of work among processes is the simplest and the simplest division is one that requires the fewest interfaces among processes.
An analyst can detect errors and emissions in a set of DFDs by looking for specific types of inconsistency. Three common and easily identifiable consistency errors as follows; differences in data flow content between a process and its process decomposition, data outflows w/o corresponding data inflows, data inflows w/o corresponding outflows. A process of decomposition shows the internal details of a higher level process in a more detailed form. In most cases, the data content of flows to and from a process at one DFD level should be equivalent to the content of data flows to and from all processes in decomposition. The equivalency is called balancing and the higher level DFD and the process decomposition DFD are said to be in balance. Data flow names can vary among levels for a number of reasons including decomposition of one combined data flow into several smaller flows. Thus, the analyst must be careful to look at the components of data flows, not just data flow names. For this reason, detailed analysis of balancing should not be undertaken until data flows have been fully defined. Unbalance DFDs may be acceptable when the imbalance is due to data flows that were ignored at the higher levels. For example, diagram 0 for a large system usually ignores details of error handling such as when an item is ordered but it is later determined to be out of stock and discontinued by its manufacturer.
Another type of DFD inconsistency can occur between data inflows and outflows of a single process or data store. By definition, a process transforms data inflows and data outflows. Analysts sometimes can spot black holes and miracles simply by examining the DFD in other cases, close examination of data dictionary or process descriptions is required.
In a logical DFD, data should not be needlessly passed into process. The following consistency rules can be derived from these facts: that all data flows into a process must flow out of the process or be used to generate data that flows out the process, all data that flows out process must have flowed into the process or have been generated from data that flowed into process.
References:
Systems Analysis and Design in a Changing World By John W. Satzinger
http://www.agilemodeling.com/artifacts/dataFlowDiagram.htm
http://it.toolbox.com/blogs/enterprise-solutions/data-flow-diagrams-dfds-14573
http://yourdon.com/strucanalysis/wiki/index.php?title=Chapter_9
Comments